Designing a report using Report Wizard
1)Programs -> Microsoft SQL Server 2008/2008 R2 -> SQL Server Business Intelligence Development Studio.
2)Create a new Project
Open File -> New -> Project (a list of templates will be display) -> Report Server Project Wizard -> Press OK button to create the project.
3)You can see a Welcome screen, press "Next >" button to process further. Now you can see a new Data Source screen. You can either use a shared data source or create a new data source.

4)Click the Edit button to connect the database as shown in the screen below. Once the database connection is set, click on OK to back the Data Source window.

5)Pres "Next" button to move the Design the Query screen. Press "Query Builder" button to open a new Query Designer window. Add authors table(and their fields) and Press OK to back Design the Query window.

6)Press Next button to select Report Type, 2 format options (Tabular and Matrix). Press Next button to Design the Table window, as shown in the screen below.

7)Press Next button to choose Table Layout screen, then press next button to move Table Style, Finally click on "Finish >>|" button to complete the wizard.
8)You can see a Completing the Wizard screen. Clicking on Finish button will open the report in the designer view of the Business Intelligence Development Studio as shown in the screen below.
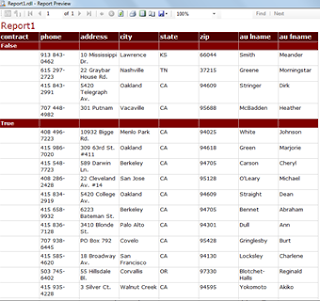
9)Press F5 key or Preview link to executing/preview the report.
Designing a report using Report Designer
1)Create a new Project
Open File -> New -> Project (a list of templates will be display) -> Report Server Project -> Press OK button to create the project.
2)Under Solutions Exporter, there 3 Project folders are available (one is Report). To add the report, click on the Reports folder and select Add -> New Item. ( Selecting Add New Report will go directly to the Report Wizard that we have already covered in the top part). Select Report from the Templates and click on Add button to add a report to the project.
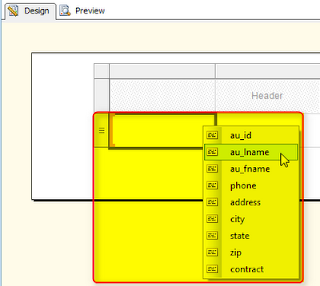
4)Go to the Tool Box, then drag and drop a table to design the report. Now to configure the data set first in order to design our report table as shown in the screen below.

Click on the New button to set new datasource. Press Query Designer button to select the tables, click OK to complete this process.
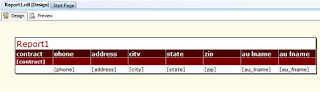
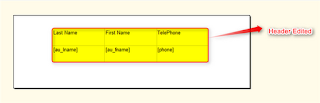
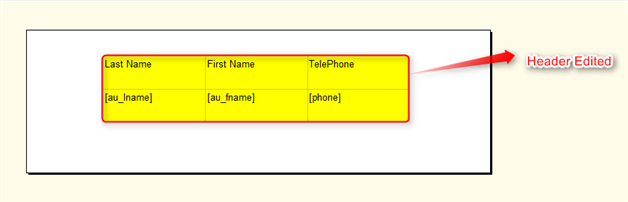
5)Now you can see the table created in the designer view, you can customize the report in your way as shown below.
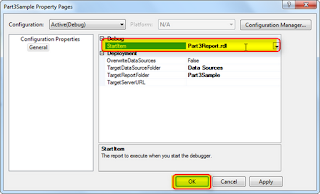
6)Go to the project properties of the solution explorer and select the report as shown in the screen below.
7)Press F5 key or Preview link to executing/preview the report.
1)Programs -> Microsoft SQL Server 2008/2008 R2 -> SQL Server Business Intelligence Development Studio.
2)Create a new Project
Open File -> New -> Project (a list of templates will be display) -> Report Server Project Wizard -> Press OK button to create the project.
3)You can see a Welcome screen, press "Next >" button to process further. Now you can see a new Data Source screen. You can either use a shared data source or create a new data source.

4)Click the Edit button to connect the database as shown in the screen below. Once the database connection is set, click on OK to back the Data Source window.

5)Pres "Next" button to move the Design the Query screen. Press "Query Builder" button to open a new Query Designer window. Add authors table(and their fields) and Press OK to back Design the Query window.

6)Press Next button to select Report Type, 2 format options (Tabular and Matrix). Press Next button to Design the Table window, as shown in the screen below.

7)Press Next button to choose Table Layout screen, then press next button to move Table Style, Finally click on "Finish >>|" button to complete the wizard.
8)You can see a Completing the Wizard screen. Clicking on Finish button will open the report in the designer view of the Business Intelligence Development Studio as shown in the screen below.

9)Press F5 key or Preview link to executing/preview the report.

Designing a report using Report Designer
1)Create a new Project
Open File -> New -> Project (a list of templates will be display) -> Report Server Project -> Press OK button to create the project.
2)Under Solutions Exporter, there 3 Project folders are available (one is Report). To add the report, click on the Reports folder and select Add -> New Item. ( Selecting Add New Report will go directly to the Report Wizard that we have already covered in the top part). Select Report from the Templates and click on Add button to add a report to the project.
4)Go to the Tool Box, then drag and drop a table to design the report. Now to configure the data set first in order to design our report table as shown in the screen below.

Click on the New button to set new datasource. Press Query Designer button to select the tables, click OK to complete this process.
5)Now you can see the table created in the designer view, you can customize the report in your way as shown below.

6)Go to the project properties of the solution explorer and select the report as shown in the screen below.

7)Press F5 key or Preview link to executing/preview the report.
Creating a Report with Charts
In the left side menu, drag and drop chart and gauge control to design chart report.

Alternate row color
In report design mode, select the details row, then from the Properties panel select the BackgroundColor property and go to edit its Expression, you will find the default value is Transparent or No Value, so replace it with this line of code:
=IIF(RowNumber(Nothing) mod 2, "Wheat", "White") and click OK.
Configure DataSources and Datasets
To Configure new/modify DataSources and Datasets, in the report design mode, From menu select View -> Report Data. From Report Data, you can add, modify and delete datasource and dataset.

 MS Dynamics CRM Contributor

No comments:
Post a Comment